Percentiles & Quartiles 📈
🎯 Learning Objectives
By the end of this lesson, you will be able to:
✔ Define percentiles and quartiles
✔ Understand their interpretation in clinical data
✔ Calculate quartiles and percentiles from a dataset
✔ Recognize their importance in descriptive statistics
1️⃣ Introduction
Sometimes, the mean and standard deviation do not give the full picture—especially when data is skewed.
Percentiles and quartiles help describe the relative position of a value in a dataset.
✅ Percentiles: Divide the data into 100 equal parts
✅ Quartiles: Divide the data into 4 equal parts
2️⃣ Percentiles
Definition:
- The value below which a given percentage of observations fall.
✔ Example:
- The 50th percentile = Median (half the data below it).
- If a child’s height is at the 90th percentile, it means the child is taller than 90% of peers.
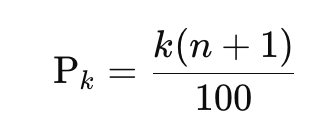
✔ Formula (Position of Percentile):

where kkk = desired percentile, nnn = number of observations.
✔ Clinical Example:
Growth charts in pediatrics use percentiles to classify children:
- <5th percentile → Underweight
- 5th–85th → Normal
95th → Obese
3️⃣ Quartiles
Definition:
- Special percentiles that divide data into four equal parts:
- Q1 (First Quartile): 25th percentile
- Q2 (Second Quartile): 50th percentile (Median)
- Q3 (Third Quartile): 75th percentile
✔ IQR (Interquartile Range):

Captures the middle 50% of data, removing extremes.
4️⃣ Example Calculation
Data: 5, 7, 8, 10, 12, 13, 15
- Q1 (25th percentile): 7
- Q2 (Median): 10
- Q3 (75th percentile): 13
- IQR: 13 – 7 = 6
5️⃣ Why Are Percentiles and Quartiles Important?
✔ Used in clinical reference ranges (e.g., lab values, growth charts).
✔ Helps understand data distribution, especially when not normally distributed.
✔ Common in non-parametric statistics.
6️⃣ Comparison Table
| Measure | Definition | Clinical Example |
|---|---|---|
| Percentile | Value below which a given % of data falls | Growth chart percentiles |
| Quartile | Divides data into 4 equal parts | Q1, Q2, Q3 in IQR |
7️⃣ Clinical Relevance
- Growth monitoring: Percentiles in child health
- Lab reference values: Often given as 2.5th–97.5th percentiles
- Hospital stay length: Reported using IQR when skewed
8️⃣ Quick Check: Test Your Understanding ✅
Q1: The median corresponds to which percentile?
a) 25th
b) 50th
c) 75th
👉 Answer: b) 50th
Q2: If Q1 = 40 and Q3 = 70, what is IQR?
👉 Answer: 30
Q3: Which measure best represents growth patterns in pediatrics?
👉 Answer: Percentiles
✨ Key Takeaways
- Percentile: Position of a value relative to the whole dataset
- Quartiles: Special percentiles (Q1 = 25%, Q2 = 50%, Q3 = 75%)
- IQR: Q3 – Q1 (middle 50%, ignores extremes)
- Widely used in clinical guidelines and research