Measures of Central Tendency – Mean, Median, Mode ➗
🎯 Learning Objectives
By the end of this lesson, you will be able to:
✔ Define Mean, Median, and Mode
✔ Understand their differences and applications
✔ Calculate each measure from a dataset
✔ Know which measure to use in which situation
1️⃣ Introduction
When we have a set of data, we often want to summarize it with a single value that represents the “center” or “average” of the data. These are called measures of central tendency, and the three most common are:
✅ Mean
✅ Median
✅ Mode
2️⃣ Mean (Arithmetic Average)
Definition:
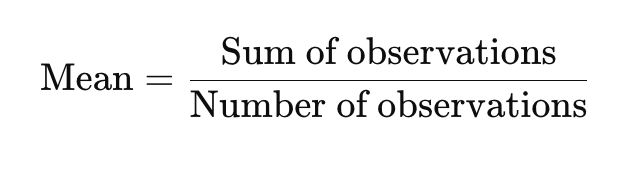
- The sum of all observations divided by the number of observations.
✔ Formula:
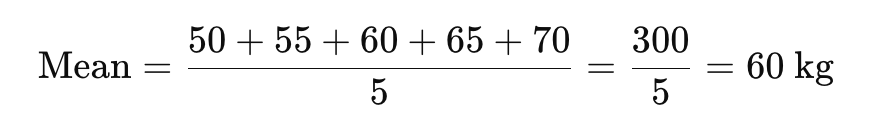
✔ Example:
If weights of 5 patients are: 50, 55, 60, 65, 70 kg
✔ Key Features:
- Affected by extreme values (outliers)
- Best for normally distributed data
3️⃣ Median
Definition:
- The middle value when all observations are arranged in ascending or descending order.
- If the number of observations is even → average of the two middle values.
✔ Example:
Data: 50, 55, 60, 65, 70
Median = 60 (middle value)
If data was 50, 55, 60, 65 → Median = (55 + 60)/2 = 57.5
✔ Key Features:
- Not affected by extreme values
- Best for skewed data
4️⃣ Mode
Definition:
- The value that occurs most frequently in the dataset.
✔ Example:
Data: 50, 55, 60, 60, 70
Mode = 60 (appears twice)
✔ Key Features:
- Can have more than one mode (bimodal or multimodal)
- Useful for categorical data
5️⃣ Comparison Table
| Measure | Definition | Affected by Outliers? | Best Use Case |
|---|---|---|---|
| Mean | Arithmetic average | ✅ Yes | Normal distribution |
| Median | Middle value | ❌ No | Skewed distribution |
| Mode | Most frequent value | ❌ No | Categorical data |
6️⃣ Clinical Relevance
- Mean: Used in lab reports (e.g., average hemoglobin level in a population).
- Median: Used in income distribution or skewed medical data like hospital stay length.
- Mode: Used for common blood groups or most frequent diagnosis.
7️⃣ Quick Check: Test Your Understanding ✅
Q1: Which measure is most appropriate for skewed data?
a) Mean
b) Median
c) Mode
👉 Answer: b) Median
Q2: The most frequently occurring blood group in a population is an example of:
a) Mean
b) Median
c) Mode
👉 Answer: c) Mode
Q3: Which measure is affected by outliers?
👉 Answer: Mean
✨ Key Takeaways
- Mean: Sum ÷ Number of values (best for normal data, but sensitive to outliers).
- Median: Middle value (best for skewed data).
- Mode: Most frequent value (best for categorical data).